The Two Year Long Process From Exploratory Data Analysis to Story

This while the majority of this analysis was conducted in August 2019, it this notebook was revisited and revised in December 2021 for use in a Eye Story. The resulting story was published in January 2022.
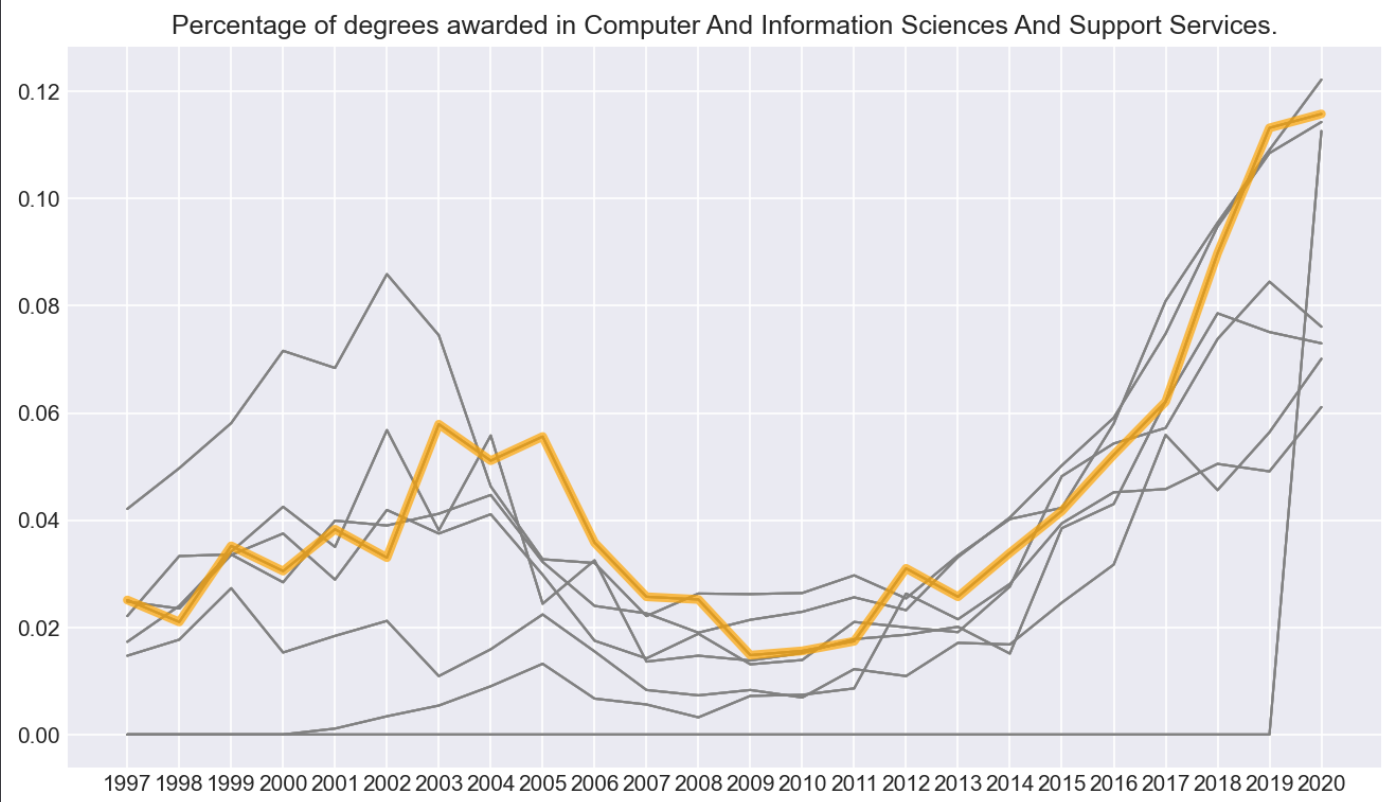
I began this analysis in an effort to learn Python and Pandas in the summer after my freshman year. I wanted to explore how popularity of majors at Columbia changes over time and compares to the rest of the Ivy League. I immediately noticed some cool patterns (like a spike in interest in technology majors during the dot-com bubble or a consistent decreasing interest in history majors over the past 20 years), but as many a potential stories this analysis got lost in the “to-do” list.
That is until last semester when a new staffer reached out curious to pick up the idea. Working with her I updated the notebook with 2019 and 2020 data, and fixed some of the broken python code. She took my analysis and used it as a foundation to guide her reporting.


