Visualizing and Reporting on COVID-19 Student Job Loss With R
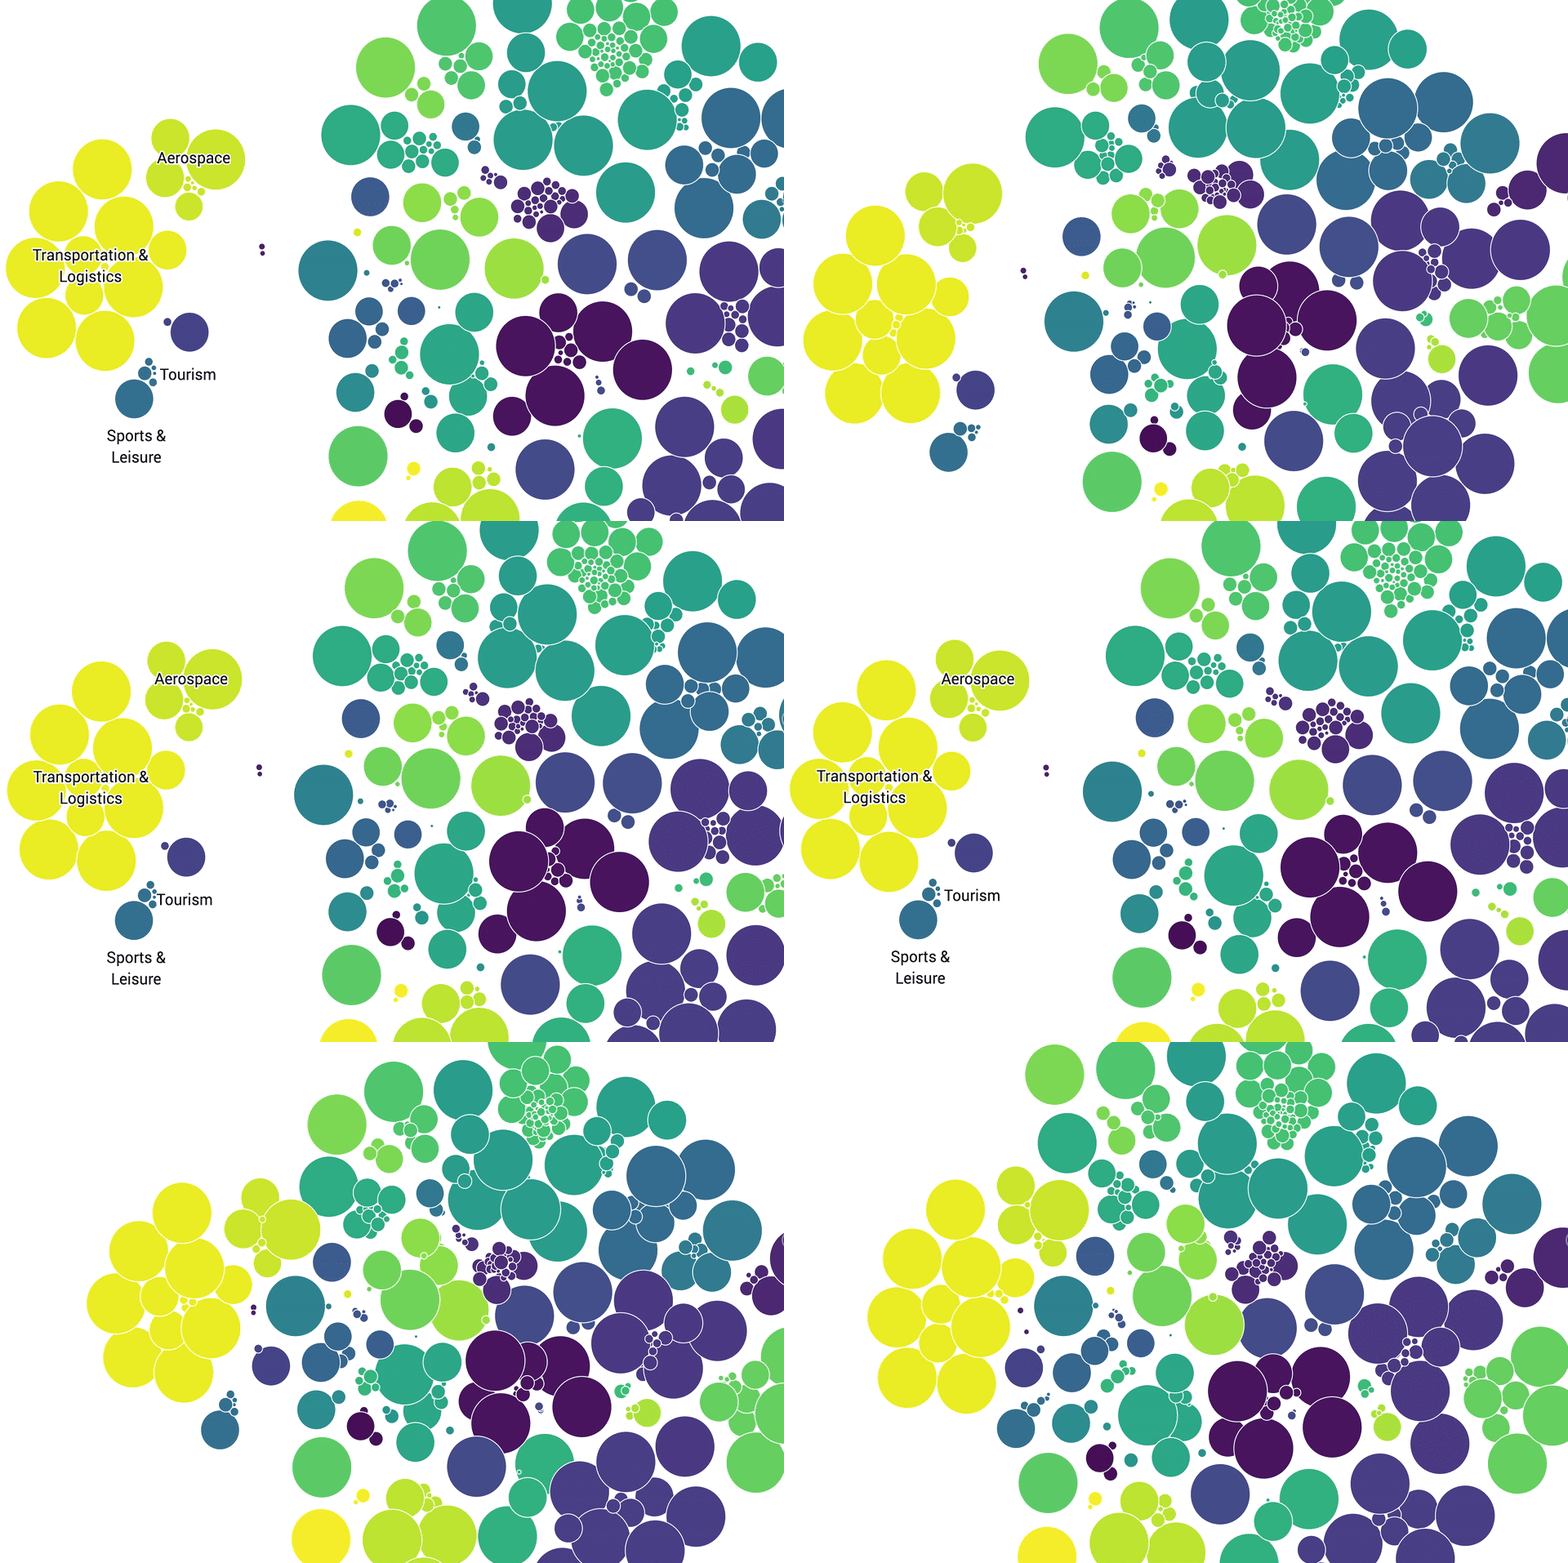
I analyzed a database with over 60,000 job postings from LionShare/Handshake, then working with a visuals team produced and reported on trends in the job market and industry changes due to COVID-19 for an enterprise story.
The story later went on to become a 2020 SPJ Region-One Finalist for Data Visualization, and a honorable mention in the 2020 Pudding Cup
See the story here
See the analysis here
Fun Fact: This story was my first time using R. I taught myself the language as I was doing the reporting, so the code is admittedly a little rougher than normal.
